Hi I'm looking to perform some timing analysis of my ROM to find out which parts of the code are using the most cycles. I can't seem to find any tools for doing this in Exodus 2.1 (there is a trace feature but it only records which instructions are executed, not when).
Ideally I'd like to be able to configure certain events, such as a write to a particular address and then log things like the data written and the current cycle count. Is this possible currently?
Timing analysis using Exodus
Moderator: Nemesis
Re: Timing analysis using Exodus
If you don't need cycle-accurate reports, you can easily do visual profiling on any emulator or even real hw. VDP_setEnable(0) and (1) around the code, and you will see on screen how many lines it takes. One line is about 500 cpu cycles.
This is a quick and easy method that lets you see, for example, that processing enemy X takes 10% of screen time.
This is a quick and easy method that lets you see, for example, that processing enemy X takes 10% of screen time.
Re: Timing analysis using Exodus
Thanks. I'm doing a variation of that currently using the background colour, but there are some limitations, you can't see what's going on during h-blank and v-blank, and it's a very manual process. It feels like it would be easy for an emulator to provide timing data directly...
Re: Timing analysis using Exodus
One idea I plan to follow through on is to provide a literal "logic analyser" mode where Exodus will produce a bus trace for you, showing the exact timing of bus events vs the clock signals. This would give you what you're after here. I actually want to be able to "record" hardware traces on the original hardware and compare them against the bus trace in Exodus using automated tools, to serve as a regression test for Exodus. If you can verify your bus trace matches hardware timing, that's kind of the ultimate timing verification tool.
Re: Timing analysis using Exodus
Thanks for replying, and great news that Exodus is being developed again!
I ended up hacking the source code to add what I needed, writing to a certain address would trigger the emulator to write the current time to a text file. Bus tracing would be overkill I think as I just want to be able to figure out which parts of my code are comsuming the most CPU time.
One question I have is, I'm calling GetCurrentTimesliceProgress() to get the time value as a double, and I notice that sometimes events get rolled back. Is this the best approach or is there a more reliable way to get the CPU time in terms of cycles?
Re: Timing analysis using Exodus
I see what you're saying. I think adding timing information to the trace logs would be the right way to go. Using GetCurrentTimesliceProgress() is good, but you'd probably be more interested in a time in clock cycles. Logging both would be best most likely. All this could be done within the Processor base class in the RecordTraceInternal() method.
In terms of rollbacks, this is handled for the trace logs inside the program that are shown in debug windows, but I notice when I added logging to file, it doesn't handle rollbacks, which is an error. What should happen is that RecordTraceInternal() method should be holding onto all the log events in memory, then writing them to file only when ExecuteCommit() is called, and dumping them if ExecuteRollback() is called. This would handle rollbacks in the file properly.
I'll add both of these to my list to fix up.
Re: Timing analysis using Exodus
Hey Matt, just letting you know I've pushed a change to Exodus which adds timing information for trace logs, both in terms of processor clock cycles and absolute system time since the last "hard reset":
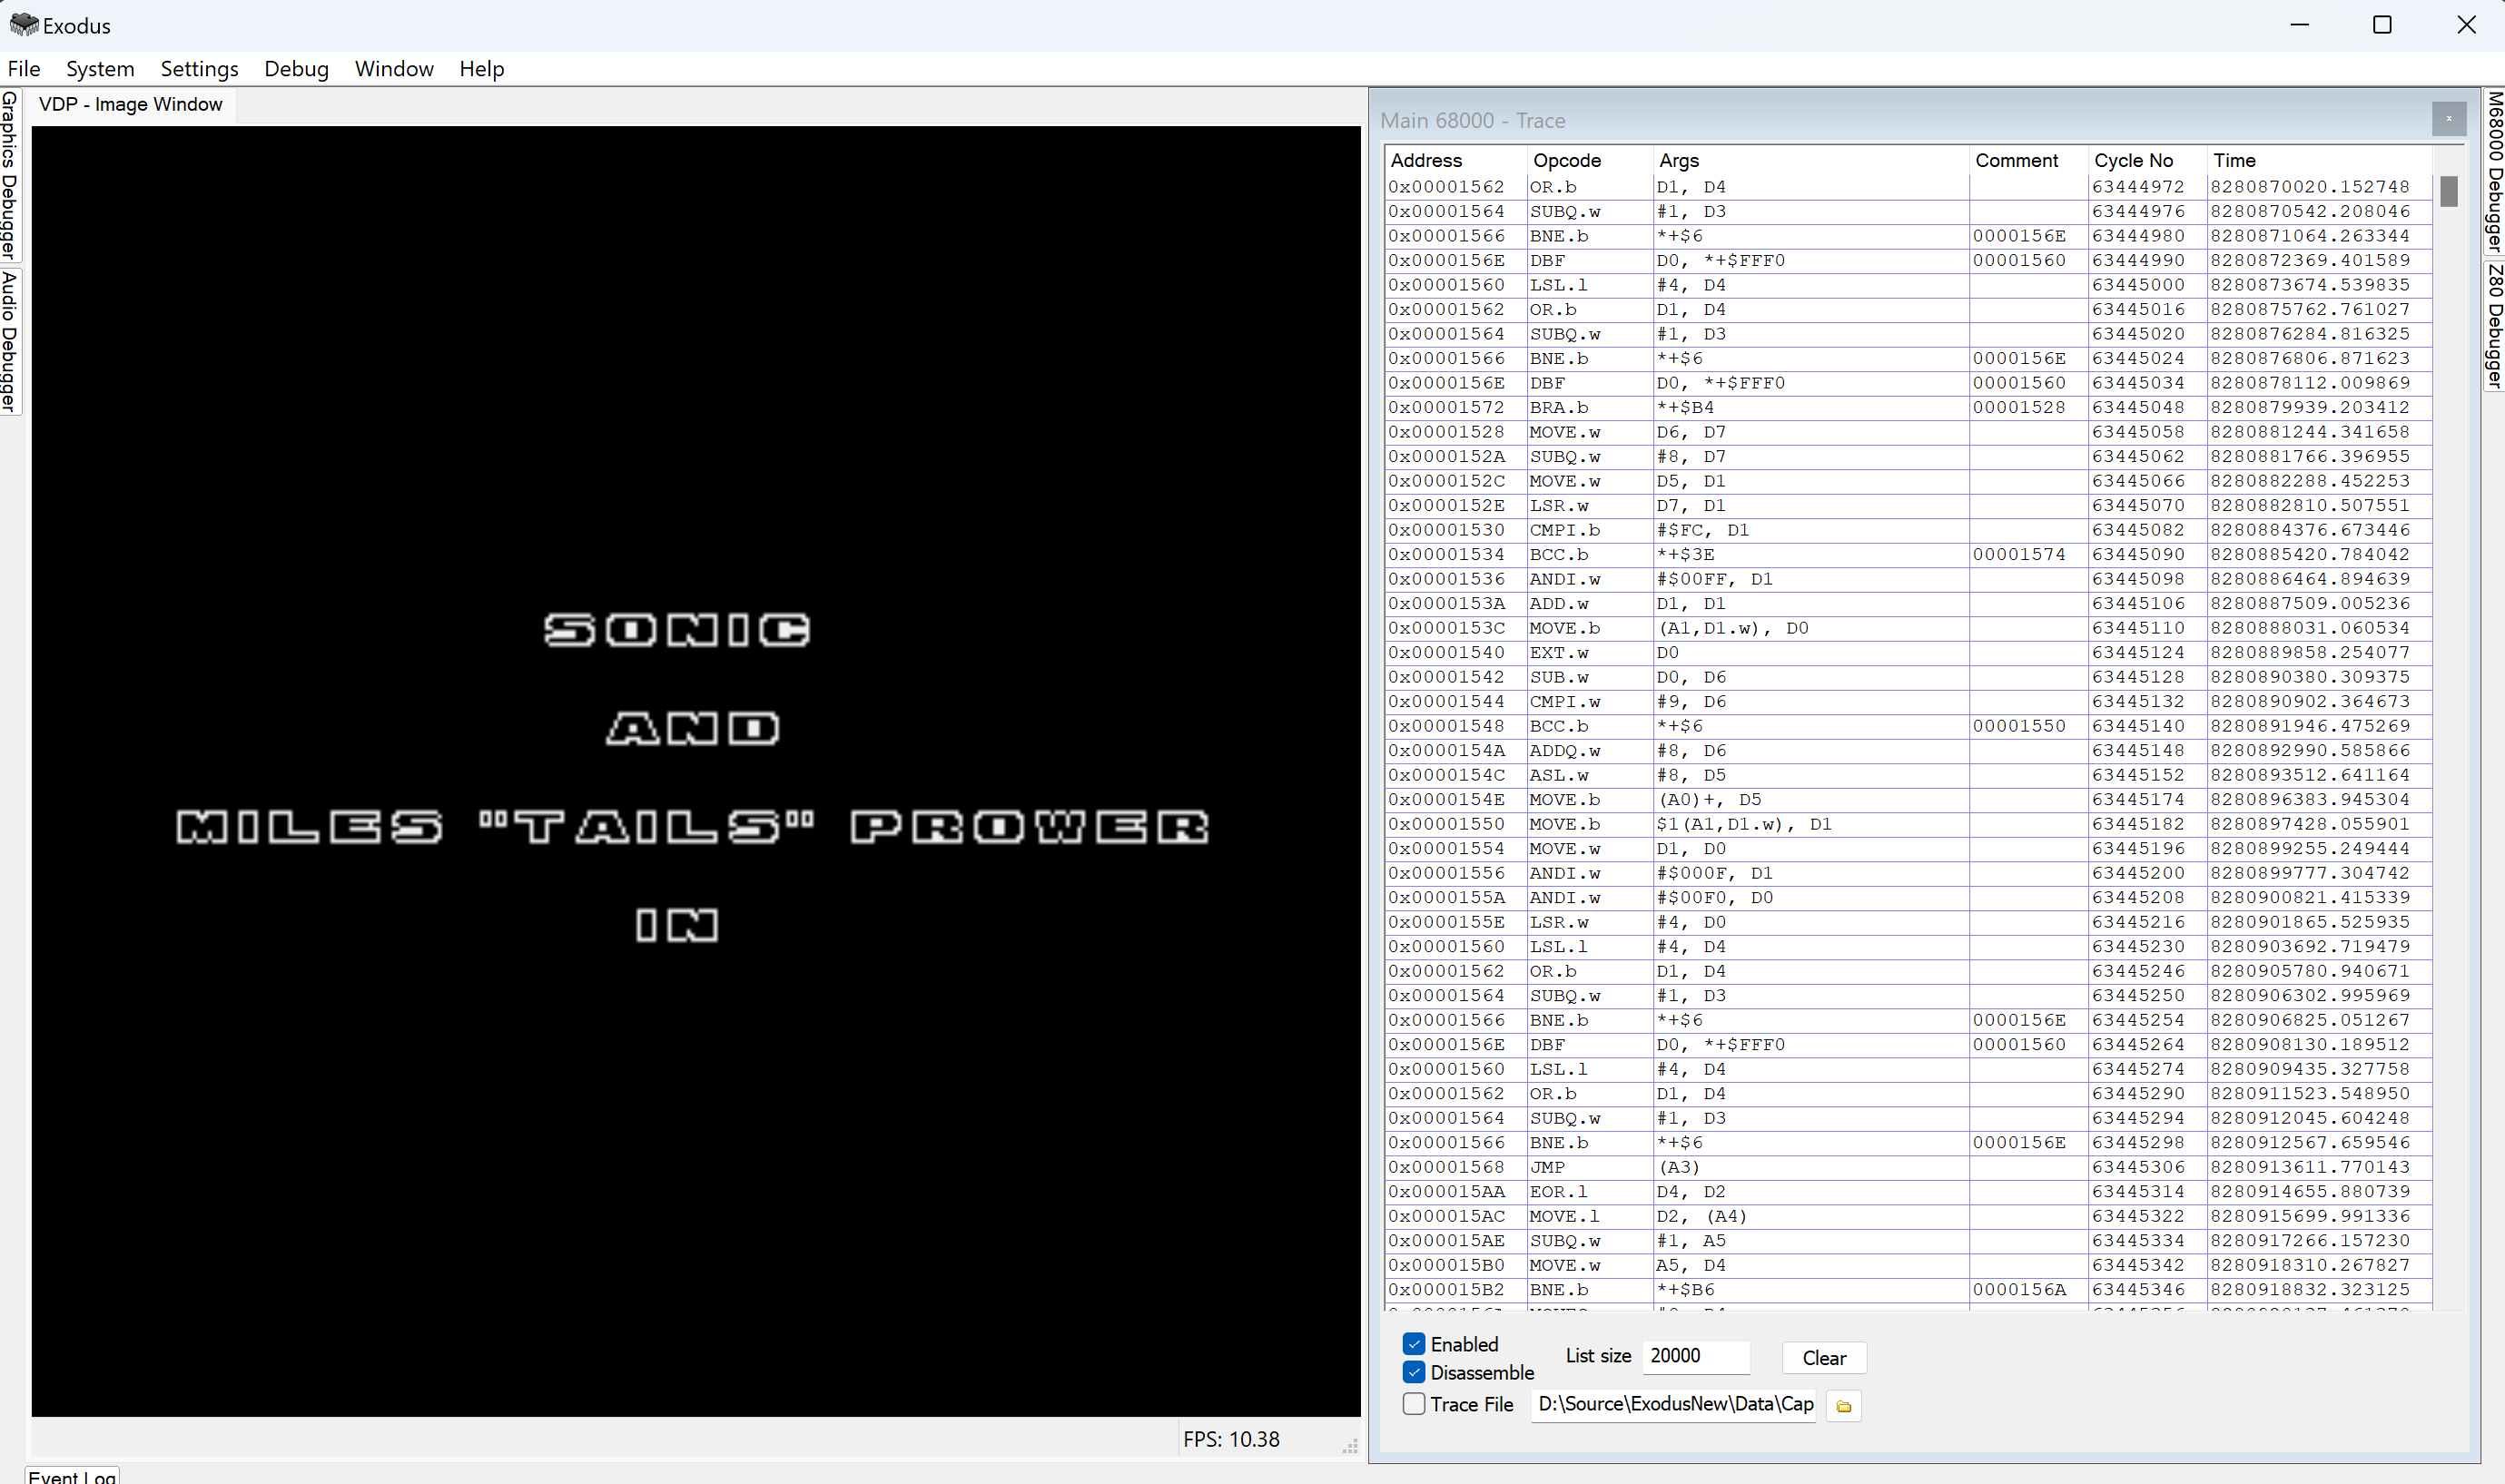
This is logged to file as well. I've also fixed the problem with rollbacks and trace logging to file, so rolled back entries will no longer appear in the output file. I've also improved performance for tracing in general.
I haven't done a release yet with these changes. I need to get CI/CD setup properly through GitHub before I do that, but I'll be working on that shortly. In the meantime you can always do a build yourself, since it sounds like that's something you've been able to do in the past.
Re: Timing analysis using Exodus
That's awesome - thanks!
Yeah I built the code before so that shouldn't be a problem. I used VS2017 last time, it looks like the project files have been upgraded to VS2022, is there anything else I'll need to change if I pull down the latest repo?
Yeah I built the code before so that shouldn't be a problem. I used VS2017 last time, it looks like the project files have been upgraded to VS2022, is there anything else I'll need to change if I pull down the latest repo?
Re: Timing analysis using Exodus
Nothing else from memory, just be aware the third party libraries haven't been updated, so they point at ancient versions that aren't all available on their original links anymore. If you use the wayback engine at archive.org you can pull down any missing ones. I'll be updating them soon.